6.1 Bioactivity Primer#
PubChem Bioactivity Primer#
Objectives
Explore PubChem Protein and Bioassay data
Distinguish between types of bioactivity data
In the first bioactivity notebook, you will be exploring potential drug candidates for the thyroid hormone receptor in both human and rat models. Before we get into the code and activity, we are going to take a closer look at the PubChem protein summary and bioassay record pages. This will allow you to make sense of the data we are looking at and gain a deeper appreciation of the cheminformatics workflows we will be completing over the next few activities.
Protein Summary Page#
Our first protein of interest is thyroid hormone receptor beta (THRβ). As a hormone receptor, it is found deep inside cells and binds to hormones like T3 and T4. When T3 or T4 bind to THRβ, a conformational change in the receptor results that either activates or supresses genes involved in the regulation of metabolism, growth and development. This receptor is found in many organs, with high activity in the liver, kidney, and brain. There is great interest in this receptor because targeting it may result in novel drugs that can treat conditions like hypercholesterolemia (high cholesterol) or fatty liver disease by altering metabolism. One important aspect of drug development is selectivity toward the β receptor, because the α receptor is found in the heart and can have serious side effects.
We are going to focus on two PubChem protein summary pages for accessions NP_001257783 and P10828.
NP_001257783https://pubchem.ncbi.nlm.nih.gov/protein/NP_001257783P10828https://pubchem.ncbi.nlm.nih.gov/protein/P10828
Click the links above to open the PubChem Summary pages in a new browser tab.
Determine the species each protein record is associated with.
Identify the gene responsible for encoding each protein.
In the Sequence-Similar Proteins section (2.2) of
NP_001257783Find out how many different types of thyroid hormone receptor (THR) proteins have data available in PubChem.
Identify other species that also have proteins similar to this one.
How many bioassays are associated with this protein (Section 4) of
NP_001257783?
A ligand is any molecule that binds to a specific site on a protein. When a ligand binds, it can change the protein’s activity by enhancing (activating) or diminishing (deactivating) its function. Ligands can be endogenous (from within) or exogenous (from outside). The naturally occuring molecules that bind to the target are “endogenous ligands” and molecules that come from other sources (natural or synthetic) are “exogenous ligands.”
Let’s explore the THRβ record in Norway rat in more detail. The protein summary also contains a list of chemicals (potential ligands) section 3.1 (tested compounds) that have been tested in bioassays for activity at each protein. Section 3.1 is a table that contains the structure, activity, activity type, activity value and PubChem CID for each tested molecule.
The bioactivity data is obtained from large-scale high-throughput screening (HTS) initiatives where millions of molecules are tested against a target and the results are compiled and uploaded to the database.
Definitions#
Activity
- **Activity**: This is the outcome of a test.Category |
Definition |
|---|---|
Probe |
A molecule with a known mechanism of action that is selective for the specific biological target being studied. Often used as a reference compound. |
Active |
A molecule that produced a positive result in the bioassay, suggesting it may interact with or affect the target. |
Inactive |
A molecule that did not produce a positive result in the assay, suggesting little or no interaction with the target. |
Inconclusive |
The assay results did not clearly indicate whether the molecule is active or inactive. More testing may be needed. |
Unspecified |
The submitter did not label the activity of the molecule, so no activity classification is available. |
Activity Type
**Activity Type**: Describes the type of biological assay performed and the way compound activity is measured.Category |
Definition |
|---|---|
IC50 |
The concentration of a compound at which it inhibits 50% of the biological activity being measured. Often used to assess how strongly a compound blocks a specific process. (See https://en.wikipedia.org/wiki/IC50) |
EC50 |
The concentration of a compound at which it produces 50% of its maximum possible effect. This is commonly used to describe activation or stimulation of a biological process. (See https://en.wikipedia.org/wiki/EC50) |
Kd |
The equilibrium dissociation constant, which reflects how tightly a ligand binds to its target. This value is typically measured directly in binding assays using a labeled ligand. (See http://www.guidetopharmacology.org/helpPage.jsp andhttps://en.wikipedia.org/wiki/Dissociation_constant) |
Ki |
The equilibrium inhibition constant, used to describe how well a compound inhibits the binding of a ligand. It is often calculated from competitive inhibition studies (See http://www.guidetopharmacology.org/helpPage.jsp and https://en.wikipedia.org/wiki/Competitive_inhibition) |
Potency/AC50 |
The concentration at which a compound shows 50% of its measured activity in a given assay. In PubChem, AC50 and potency are often used interchangeably, and may refer to IC50, EC50,or other similar metrics. Check the individual BioAssay record for exact definitions. |
Activity Value, µM: This is the numerical value reported from a bioassay that describes how potent the tested compound is against the biological target. This is typically expressed as µM units, which reflects the concentration of the compound required to produce a specific level of activity. This is often linked with the IC50, EC50, or potency/AC50 values. The lower the number the better. Molecules that have high affinity for the target will have activity values in the subnanomolar range (0.0001 µM or lower).
Compound CID: PubChem’s compound identifier for a unique chemical structure.
In the top right hand corner of the tested compounds table you can sort by activity or by Activity Value.
Exploration of the tested compounds table
How many compounds have been tested against this protein?
Sort the table by Increasing Activity value. How may of the first 5 molecules reported have subnanomolar potency?
Using the search function in the table, find Compound ID 104741.
How many times is this compound in the table?
Does this molecule have strong affinity for the receptor?
Does having strong affinity necessarily mean that the molecule will be active?
BioAssays#
Depositors can provide descriptions and test results which is found in the bioassay section. In the previous exploration section, you found that there were 3 bioassay IDs (AID) associated with the protein. To understand how to interpret the data we need some more definitions.
Click on the following link to go to Section 4 BioAssays for this protein.
There are 4 ways that assay outcome data are defined.
Category |
Description |
|---|---|
Primary Screening |
A screening assay performed at a single concentration to determine whether a molecule shows activity or not. Potency values are not calculated. This type of assay is especially useful for identifying potential new lead compounds. These are often referred to as qualitative screenings. |
Confirmatory |
An assay designed to confirm activity by measuring a concentration–response relationship (e.g., EC50, IC50) of a molecule and reporting potency values. These are often referred to as quantitative screenings. |
Summary |
A summary assay that provides an overview of results from multiple related assays, often with links to the individual experiments. |
Other |
Any assay type that does not fit into the categories above. |
Looking at Section 4 BioAssays, you can now see that two of these assays are classified as confirmatory, and one as a summary. Our focus will be on the two confirmatory assays Bioassay AID 743065 and Bioassasy AID 743066. Both are designed to measure activity at the thyroid receptor signalling pathway, but they test for two very different types of interactions. One screens for antagonist activity and the other for agonist activity, respectively.
Definitions
Category |
Description |
|---|---|
Agonist |
A molecule that binds to a receptor and activates it, producing a biological response similar to the endogenous ligand. May be referred to as a “full agonist” because it can match the effect of the endogenous ligand. |
Antagonist |
A molecule that binds to a receptor and does not activate it. It blocks the active site of the target preventing the endogenous ligand (or an agonist) from binding and producing a response. |
Partial Agonist |
A molecule that binds to and activates the target but to a lesser extent than the natural ligand or “full” agonists. |
Inverse Agonist |
A molecule that binds to the receptor, but decreases its constituative (baseline) activity. Instead of blocking the effect like an antagonist, it actively causes the opposite effect. |
This next code block simulates dose response curves to indicate how each of these types of interactions would like like in an experiment that measures EC50.
# Generated with ChatGPT Model 5 on 8/15/2025
import numpy as np
import matplotlib.pyplot as plt

# Concentration range (µM) on a log scale
concentration = np.logspace(-2, 2, 200)  # 0.01 to 100 µM

# Define response functions
def full_agonist(x):
    return 100 * (x / (x + 1))   # Emax = 100%

def partial_agonist(x):
    return 50 * (x / (x + 1))    # Emax = 50%

def inverse_agonist(x):
    return -30 * (x / (x + 1))   # Negative effect (reduces baseline activity)

def antagonist(x):
    return np.zeros_like(x)      # No effect

# Plot
plt.figure(figsize=(7, 5))

plt.semilogx(concentration, full_agonist(concentration),
             label="Full Agonist", linewidth=2)
plt.semilogx(concentration, partial_agonist(concentration),
             label="Partial Agonist", linewidth=2)
plt.semilogx(concentration, antagonist(concentration),
             label="Antagonist", linewidth=2, linestyle="--", color="red")
plt.semilogx(concentration, inverse_agonist(concentration),
             label="Inverse Agonist", linewidth=2)


# Formatting
plt.axhline(0, color='black', linewidth=0.8)
plt.xlabel("Ligand Concentration (µM, log scale)", fontsize=12)
plt.ylabel("Response (% of Max Effect)", fontsize=12)
plt.title("Dose–Response Curves for Different Ligand Types", fontsize=14)
plt.legend()
plt.grid(True, which="both", ls="--", lw=0.5)

plt.show()
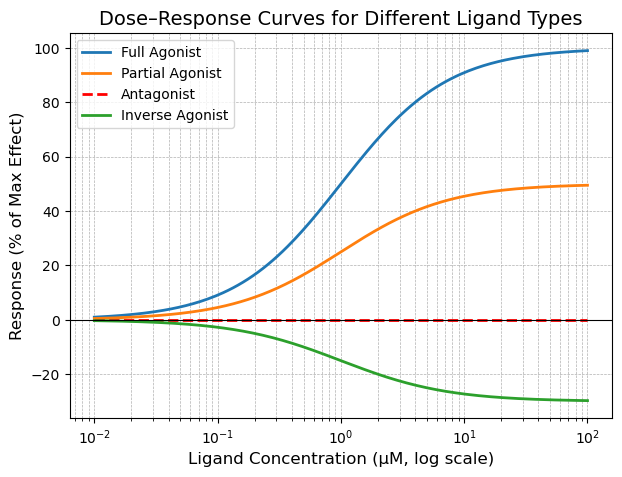
The dose response curve above shows that the full agonist results in a 100% of maximum effect, the partial agonist has a 50% maximal effect, the antagonist has no effect (remains at baseline), and the inverse agonist dereases baseline effect by 30%.
Illustration of EC50 and Full Agonism#
The following code block generates a plot of a hypothetical dose response curve analogous to what may be seen in a qHTS screen.
# Generated with ChatGPT Model 5 on 8/15/2025
import numpy as np
import matplotlib.pyplot as plt

# ---- Model & parameters ----
def agonist(conc, EC50):
    """Simple Hill-like response with Hill coefficient = 1 and Emax = 100%."""
    return 100 * (conc / (conc + EC50))


EC50_high = 0.01   # high potency agonist
EC50_low  = 0.1    # low potency agonist

# Concentration range (µM): 0.0001 to 10 on a log scale
conc = np.logspace(-4, 1, 300)

# Responses
resp_high = agonist(conc, EC50_high)
resp_low  = agonist(conc, EC50_low)

# EC50 response level (50% of max)
ec50_level = 50.0

# ---- Plot ----
plt.figure(figsize=(7, 5))

# Dose–response curves
plt.semilogx(conc, resp_high, label="High Potency (EC50 = 0.01 µM)",
             linewidth=2, color="blue")
plt.semilogx(conc, resp_low,  label="Low Potency (EC50 = 0.1 µM)",
             linewidth=2, linestyle="--", color="blue")

# EC50 indicators:
# Horizontal 50% line across the plot
plt.axhline(ec50_level, color="black", linewidth=1)

# Vertical lines up to the 50% response level for each EC50
plt.vlines(EC50_high, ymin=0, ymax=ec50_level, color="black", linewidth=1)
plt.vlines(EC50_low,  ymin=0, ymax=ec50_level, color="black", linewidth=1)

# Axes, labels, aesthetics
plt.xlim(1e-4, 10)
plt.ylim(0, 102)
plt.xlabel("Ligand Concentration (µM, log scale)", fontsize=12)
plt.ylabel("Response (% of Max Effect)", fontsize=12)
plt.title("Dose–Response Curves with EC50 Indicators", fontsize=14)
plt.legend()
plt.grid(True, which="both", ls="--", lw=0.5)

plt.show()
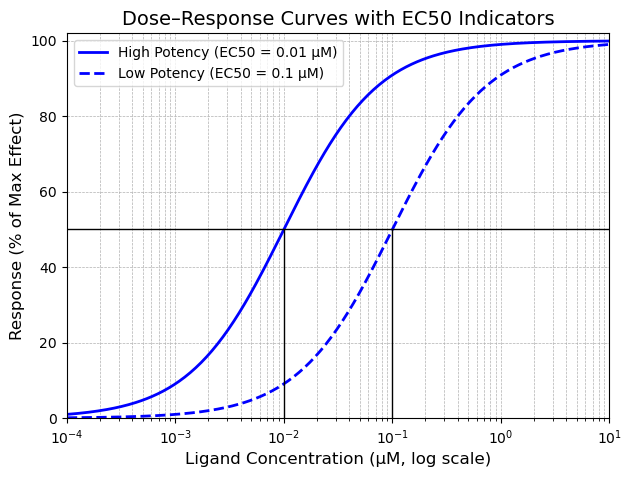
Notice that these are both agonists resulting in 100% maximal biological response. The solid blue curve has a lower EC50 than the dashed blue curve, meaning it is more potent as it takes a 0.01 µM concentration to elicit a 50% maximal response. There is a 10-fold difference in potency between the two molecules, but both are full agonists resulting in 100% biological response.
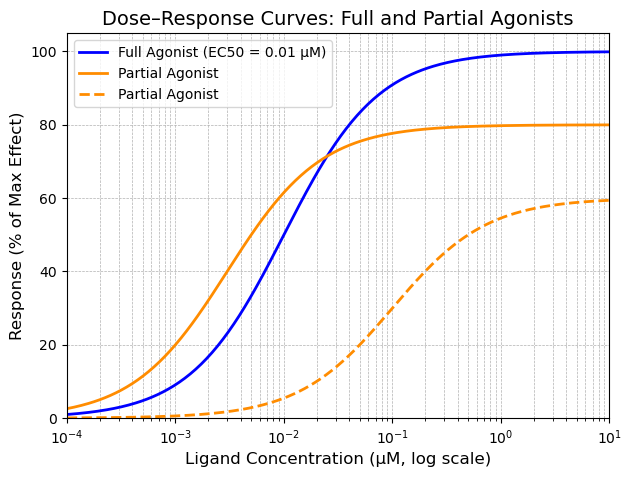
Illustration of EC50 and Partial Agonism#
# Generated with ChatGPT Model 5 on 8/15/2025
import numpy as np
import matplotlib.pyplot as plt

# Hill-like response (n = 1) with configurable Emax and EC50
def response(conc, EC50, Emax=100):
    return Emax * (conc / (conc + EC50))

# Parameters (µM)
EC50_full = 0.01
EC50_partial_orange = 0.003 # 80% Emax (orange curve)
EC50_partial2 = 0.1          # 60% Emax

# Concentration range (µM): 0.0001 to 10 on a log scale
conc = np.logspace(-4, 1, 300)

# Compute responses
resp_full = response(conc, EC50_full, Emax=100)
resp_partial_orange = response(conc, EC50_partial_orange, Emax=80)
resp_partial2 = response(conc, EC50_partial2, Emax=60)

# Plot
plt.figure(figsize=(7,5))
plt.semilogx(conc, resp_full, linewidth=2,
             label="Full Agonist (EC50 = 0.01 µM)", color="blue")
plt.semilogx(conc, resp_partial_orange, linewidth=2,
             label="Partial Agonist", color="darkorange")
plt.semilogx(conc, resp_partial2, linewidth=2,
             label="Partial Agonist", color="darkorange", linestyle="--")


# Axis labels and formatting
plt.xlabel("Ligand Concentration (µM, log scale)", fontsize=12)
plt.ylabel("Response (% of Max Effect)", fontsize=12)
plt.title("Dose–Response Curves: Full and Partial Agonists", fontsize=14)
plt.legend()
plt.grid(True, which="both", ls="--", lw=0.5)
plt.xlim(1e-4, 10)
plt.ylim(0, 105)

plt.show()
Check your Understanding
By only looking at the above graph:
Identify which partial agonist is more potent than the full agonist (solid orange or dashed)?
Determine the EC50 values for each partial agonist.
Go back to Section 4 BioAssays and let’s click on the links for each bioassay. First we will look at Bioassay AID 743066.
On this page is a description of the assay and its protocol. In this bioassay, cells will turn on a luciferase pathway and light up when the thyroid pathway is activated. The positive control is T3, the endogenous ligand, and the negative control is DMSO, a common solvent used for dissolving compounds in these tests. After incubation, a luciferase reagent is added and the light output is measured.
If a compound is an agonist, it should increase lumininescence. A full agonist will give the same light intensity, and a partial agonist will give lower intensity. The amount of compound needed is the measure of potency. If it is inactive, the signal will look like DMSO. The key aspect of this test is that T3 defines what activation looks like and agonists mimic T3 in the test, while non-agonists do not.
Check your Understanding: Agonist-mode interpretation (T3 as positive control)
In this assay, DMSO gives baseline light and T3 gives high light. You test four compounds at a single high concentration and record luminescence (relative to DMSO = 1.0, T3 = 1.0 means “same as T3,” etc.):
Compound |
Luninescence vs. control |
|---|---|
A |
~1.0 × T3 (same as T3) |
B |
~0.6 × T3 (above DMSO, below T3) |
C |
~1.0 × DMSO (same as DMSO) |
D |
~1.0 × T3 (same as T3), but only after using much more compound than needed for T3 |
Classify A–D as a partial agonist, full agonist, or inactive, and comment on potency where relevant. Briefly justify each choice.
Now, let’s look at Bioassay AID 743065. In this bioassay, cells carrying the same luciferase gets the test compound or DMSO first. Then a fixed dose of 1 nM T3 is added to the cells and incubated for 24 hours. Then two different tests are administered. The first is to determine if the cells are still viable. If the cells are dead, they will not activate when the luciferase reagent is added and look the same as if antagonized. After cells are shown to be viable, antagonist activity can be determined. If the T3-induced light is decreased, the compound is an antagonist. If the light is the same as the T3 in vehicle, it is inactive. If the cells are dead, the molecule is determined to be cytotoxic.
Check your Understanding: Antagonist-mode with viability control (T3 added at 1 nM)
In this assay, T3 + vehicle gives high light (activation). You test three compounds (each co-applied with 1 nM T3) and measure luminescence and cell viability:
CID |
Luminescence vs. control(T3 alone) |
Viabilility |
|---|---|---|
X |
about the same as T3 control |
95% |
Y |
decreased 30% compared to T3 |
20% |
Z |
decreased 40% compared to T3 |
98% |
Classify X, Y, and Z as antagonist, inactive, or cytotoxic, and explain your reasoning using both luminescence and viability data.
Go back to Section 4 BioAssays and search for PubChem CID 5803. Click on any of the activity values or structure images that result from the search. This will take you to a new page that is the bioactivity dyad page indicating that these two pages are linked in some way.
Look at Section 2: Bioactivities
Identify the rows in the column that are associated with BioAssay AID 743066 and BioAssay AID 743065.
Check your Understanding
Is CID 5803 active or inactive in BioAssay AID 743066?
Is CID 5803 active or inactive in BioAssay AID 743065?
Is CID 5803 and agonist or an antagonist of the thyroid receptor signalling pathway?
Homework
At the beginning of this notebook, it was suggested that molecules that are active for thyroid hormone receptor α can have serious side effects.
Explore the Related Bioactivities section and similar proteins that CID 5803 was tested in. Is CID 5803 selective for THRβ protein, or should there be concern moving forward if this molecule was further developed?
Acknowledgment#
This module was developed by Ehren Bucholtz and has a CC BY-NC-SA 4.0 license.