4. Built-In Modules#
Table of Built-In Modules#
Module |
Description |
|---|---|
|
Provides basic mathematical functions like |
|
Provides basic complex mathematical functions to deal with complex number |
|
Offers functionality for generating random numbers, shuffling sequences, and picking random items from lists. |
|
Enables interaction with the operating system, such as working with files, directories, and environment variables. |
|
Gives access to system-specific parameters and functions, including command-line arguments and the Python runtime. |
|
Provides time-related functions, like getting the current time, pausing execution ( |
|
Supplies classes for manipulating dates and times, including formatting and arithmetic with time objects. |
|
Implements regular expression operations for string searching, matching, and substitution. |
|
Lets you read and write JSON (JavaScript Object Notation) data for easy data serialization and sharing. |
|
Simplifies reading and writing CSV (Comma-Separated Values) files. |
|
Statistics methods and functions. |
Math Module#
Overview#
The math module is a built-in module that comes with your installation of python. When you start Python it is not loaded into memory and you need to import it before you can use it with the statement:
import math
Table of Common Math functions#
Method/Constant |
Description |
|---|---|
|
Returns the smallest integer greater than or equal to x |
|
Returns the largest integer less than or equal to x |
|
Returns the absolute value of x |
|
Returns the factorial of x |
|
Returns the greatest common divisor of a and b |
|
Returns e raised to the power of x |
|
Returns the logarithm of x to the given base (default is e) |
|
Returns the base-10 logarithm of x |
|
Returns x raised to the power of y |
|
Returns the square root of x |
|
Returns the sine of x (x in radians) |
|
Returns the cosine of x (x in radians) |
|
Returns the tangent of x (x in radians) |
|
Converts angle x from radians to degrees |
|
Converts angle x from degrees to radians |
|
Mathematical constant pi (3.141592…) |
|
Mathematical constant e (2.718281…) |
Random Module#
Function/Method |
Description |
Example |
|---|---|---|
|
Returns a random float between 0 and 1. |
|
|
Returns a random float between |
|
|
Returns a random integer between |
|
|
Returns a random integer from |
|
|
Returns a random element from a non-empty sequence. |
|
|
Returns |
|
|
Returns |
|
|
Shuffles a list in place. |
|
|
Initializes the random number generator for reproducibility. |
|
|
Generates a random number from a normal distribution with mean |
|
|
Returns a random number from an exponential distribution with rate parameter |
|
|
Returns a random number from a Beta distribution. |
|
import random

# Seeding for reproducibility
random.seed(42)

# Generate random float
print("Random float (0-1):", random.random())

# Generate random integer
print("Random integer (1-10):", random.randint(1, 10))

# Generate a random float in a range
print("Random float (10-20):", random.uniform(10, 20))

# Random choice from a list
elements = ['H', 'He', 'Li', 'Be', 'B']
print("Random element:", random.choice(elements))

# Random sample (without replacement)
print("Random sample of 3 elements:", random.sample(elements, 3))

# Shuffle a list
random.shuffle(elements)
print("Shuffled elements:", elements)

# Normal distribution
print("Random number from normal distribution (mean=0, std=1):", random.gauss(0, 1))
Random float (0-1): 0.6394267984578837
Random integer (1-10): 1
Random float (10-20): 17.41550499759833
Random element: He
Random sample of 3 elements: ['He', 'B', 'Li']
Shuffled elements: ['Be', 'He', 'Li', 'B', 'H']
Random number from normal distribution (mean=0, std=1): 0.4347603342594289
Statistics Module#
Overview#
The statistics module is part of Pythons standard (built-in) library and is useful for small data sets. We will be using Numpy and Pandas for larger data sets. But first things first.
Table Statistics Methods#
Function Name |
Description |
|---|---|
|
Returns the arithmetic mean of a numeric dataset. |
|
Returns the median (middle value) of numeric data. |
|
Returns the lower median of numeric data. |
|
Returns the higher median of numeric data. |
|
Returns the most common value in a dataset. |
|
Returns a list of the most frequently occurring values. |
|
Returns the sample variance of a dataset. |
|
Returns the sample standard deviation. |
|
Returns the population variance. |
|
Returns the population standard deviation. |
|
Returns the arithmetic mean as a floating-point number (faster than |
|
Returns the geometric mean of positive numbers. |
|
Returns the harmonic mean of positive numbers. |
|
Divides data into equal intervals (default is quartiles). |
|
Computes Pearson’s correlation coefficient between two datasets. |
|
Computes the covariance between two datasets. |
|
Computes slope and intercept of simple linear regression. |
|
Returns a random float from a normal distribution. |
|
Generates a random number based on the Gaussian distribution. |
Examples#
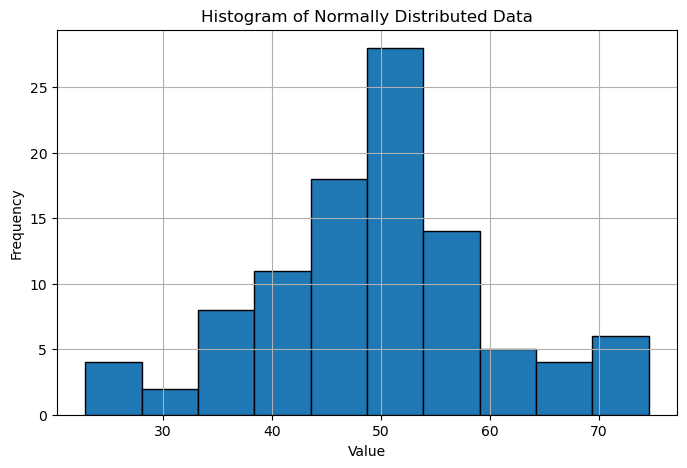
Create Normally Distributed Data Set#
The following code will generate 100 datapoints with a random gaussian distribution centered around 50 and plot it using matplotlib
import random
import matplotlib.pyplot as plt

# Set seed for reproducibility
random.seed(32)

# Generate 100 data points with a normal distribution (mean = 50, stdev = 10)
data = [random.gauss(50, 10) for _ in range(100)]

# Optional: Round values for simpler interpretation
data = [round(num, 2) for num in data]

# Preview first 10 values
print(data[:10])
plt.figure(figsize=(8, 5))
plt.hist(data, bins=10, edgecolor='black')
plt.title('Histogram of Normally Distributed Data')
plt.xlabel('Value')
plt.ylabel('Frequency')
plt.grid(True)
plt.show()
[56.13, 53.24, 42.97, 70.28, 34.04, 50.38, 59.64, 57.02, 56.71, 39.86]
Mean (Arithmetic Average)#
The mean is the sum of all numbers in the dataset divided by the number of values. It gives a sense of the “typical” value.
import statistics

mean_value = statistics.mean(data)
print(f"Mean: {mean_value}")
Mean: 49.4651
Median (Middle Value)#
The median is the middle value in a sorted list. If there’s an even number of values, it’s the average of the two middle ones.
median_value = statistics.median(data)
print(f"Median: {median_value}")
Median: 50.33
Mode (Most Frequent Value)#
The mode is the most commonly occurring value in the dataset. A dataset can have more than one mode (bimodal, multimodal).
mode_value = statistics.mode(data)
print(f"Mode: {mode_value}")
Mode: 52.66
Multimode (All Most Frequent Values)#
Multimode returns a list of all values that appear with the highest frequency. Useful if there are ties. This returns a list
multimode_values = statistics.multimode(data)
print(f"Multimode: {multimode_values}")
print(type(multimode_values))
Multimode: [52.66]
<class 'list'>
Variance (Sample)#
Sample variance measures how spread out the data is from the mean. Higher variance means more spread.
sample_variance = statistics.variance(data)
print(f"Sample Variance: {sample_variance}")
Sample Variance: 112.42942120202021
Standard Deviation (Sample)#
Standard deviation is the square root of variance. It tells us the typical distance of values from the mean.
sample_stdev = statistics.stdev(data)
print(f"Sample Standard Deviation: {sample_stdev}")
Sample Standard Deviation: 10.603274079359648
Population Variance & Standard Deviation#
If your dataset represents the entire population (not a sample), use pvariance() and pstdev()
population_variance = statistics.pvariance(data)
population_stdev = statistics.pstdev(data)

print(f"Population Variance: {population_variance}")
print(f"Population Standard Deviation: {population_stdev}")
Population Variance: 111.30512699
Population Standard Deviation: 10.550124501161113
Quantiles#
Quantiles divide your data into equal-sized intervals. For example, quartiles divide the data into 4 parts.
quartiles = statistics.quantiles(data, n=4)
print(f"Quartiles: {quartiles}")
Quartiles: [43.53, 50.33, 54.805]
Geometric Mean#
The geometric mean is used for data that multiplies over time (e.g., growth rates). It’s the nth root of the product of the data
geo_mean = statistics.geometric_mean(data)
print(f"Geometric Mean: {geo_mean}")
Geometric Mean: 48.25233824320789
Correlation and Covariance (Optional Intro)#
Correlation shows how two variables move together. +1 is perfect positive, -1 is perfect negative, 0 is no relation.
# Generate a second variable (y) that tracks x with some noise
x = list(range(25))
y = [d + random.randint(-5, 5) for d in data]

corr = statistics.correlation(data, y)
cov = statistics.covariance(data, y)

print(f"Correlation: {corr}")
print(f"Covariance: {cov}")
Correlation: 0.9514448415358394
Covariance: 113.6918302929293
Complex Math cmath Module#
Overview#
Purpose: Perform mathematical operations on complex numbers, such as trigonometric, logarithmic, and exponential functions.
Key Difference from
math: While themathmodule raises errors for invalid operations on real numbers (e.g., square root of a negative number),cmathseamlessly handles such cases by returning a complex result.
Table of Common cmath Functions#
Below is a table of common functions available in the cmath module that are not directly accessible with standard Python operations:
Function |
Description |
|---|---|
|
Returns the square root of the complex number |
|
Returns the exponential of the complex number |
|
Returns the natural logarithm (base |
|
Returns the base-10 logarithm of |
|
Returns the phase (angle in radians) of |
|
Returns a tuple |
|
Converts polar coordinates |
|
Returns the sine of |
|
Returns the cosine of |
|
Returns the tangent of |
|
Returns the inverse sine of |
|
Returns the inverse cosine of |
|
Returns the inverse tangent of |
|
Returns the hyperbolic sine of |
|
Returns the hyperbolic cosine of |
|
Returns the hyperbolic tangent of |
Acknowledgements#
This content was developed with assistance from Perplexity AI and Chat GPT. Multiple queries were made during the Fall 2024 and the Spring 2025.