10. RDKit and Descriptors#
Desriptors and neurmuscular blockers#
The following is a list of neuromuscular blockers:
Drug Name |
Notes |
|---|---|
Atracurium |
Benchmark; undergoes Hofmann elimination |
Cisatracurium |
Isomer of atracurium; fewer side effects |
Vecuronium |
Intermediate-acting aminosteroid |
Rocuronium |
Rapid onset; widely used in surgery |
Pancuronium |
Long-acting aminosteroid |
Mivacurium |
Short-acting benzylisoquinolinium |
Tubocurarine |
Natural product; historical use |
Create a DataFrame of names and SMILES#
import requests
import pandas as pd


# List of drug names to retrieve
drug_names = ["Atracurium", "Cisatracurium", "Vecuronium",
              "Rocuronium", "Pancuronium", "Mivacurium", "Tubocurarine"]

# Prepare lists to store results
smiles_list = []

# Loop through names and retrieve Canonical SMILES
for name in drug_names:
    try:
        url = f"https://pubchem.ncbi.nlm.nih.gov/rest/pug/compound/name/{name}/property/ConnectivitySMILES/JSON"
        res = requests.get(url)
        res.raise_for_status()
        smiles = res.json()['PropertyTable']['Properties'][0]['ConnectivitySMILES']
        smiles_list.append(smiles)
    except Exception as e:
        smiles_list.append(None)
        print(f"Could not retrieve SMILES for {name}: {e}")

# Create DataFrame

df = pd.DataFrame({"Name": drug_names, "SMILES": smiles_list})


# Display the DataFrame
df
| Name | SMILES | |
|---|---|---|
| 0 | Atracurium | C[N+]1(CCC2=CC(=C(C=C2C1CC3=CC(=C(C=C3)OC)OC)O... |
| 1 | Cisatracurium | C[N+]1(CCC2=CC(=C(C=C2C1CC3=CC(=C(C=C3)OC)OC)O... |
| 2 | Vecuronium | CC(=O)OC1CC2CCC3C(C2(CC1N4CCCCC4)C)CCC5(C3CC(C... |
| 3 | Rocuronium | CC(=O)OC1C(CC2C1(CCC3C2CCC4C3(CC(C(C4)O)N5CCOC... |
| 4 | Pancuronium | CC(=O)OC1CC2CCC3C(C2(CC1[N+]4(CCCCC4)C)C)CCC5(... |
| 5 | Mivacurium | C[N+]1(CCC2=CC(=C(C=C2C1CC3=CC(=C(C(=C3)OC)OC)... |
| 6 | Tubocurarine | CN1CCC2=CC(=C3C=C2C1CC4=CC=C(C=C4)OC5=C6C(CC7=... |
Add Field for RDKit molecualar objects#
from rdkit import Chem
from rdkit.Chem import PandasTools
from rdkit.Chem.Draw import IPythonConsole  # Enables RDKit molecule display in Jupyter
# Use pandas broadcasting (apply over the SMILES column) to generate RDKit Mol objects
df["Mol"] = df["SMILES"].apply(lambda s: Chem.MolFromSmiles(s) if pd.notna(s) else None)

# Optional: enable molecule image rendering in the DataFrame (for Jupyter notebooks)
PandasTools.RenderImagesInAllDataFrames(images=True)

# Display the DataFrame
df
| Name | SMILES | Mol | |
|---|---|---|---|
| 0 | Atracurium | C[N+]1(CCC2=CC(=C(C=C2C1CC3=CC(=C(C=C3)OC)OC)O... |  |
| 1 | Cisatracurium | C[N+]1(CCC2=CC(=C(C=C2C1CC3=CC(=C(C=C3)OC)OC)O... | |
| 2 | Vecuronium | CC(=O)OC1CC2CCC3C(C2(CC1N4CCCCC4)C)CCC5(C3CC(C... |  |
| 3 | Rocuronium | CC(=O)OC1C(CC2C1(CCC3C2CCC4C3(CC(C(C4)O)N5CCOC... |  |
| 4 | Pancuronium | CC(=O)OC1CC2CCC3C(C2(CC1[N+]4(CCCCC4)C)C)CCC5(... |  |
| 5 | Mivacurium | C[N+]1(CCC2=CC(=C(C=C2C1CC3=CC(=C(C(=C3)OC)OC)... |  |
| 6 | Tubocurarine | CN1CCC2=CC(=C3C=C2C1CC4=CC=C(C=C4)OC5=C6C(CC7=... |  |
What is the Data Type of the Mol column with the image
# Render dataframe (shows molecule images)
display(df)

# Print out Python types under each column
print("Column data types (based on first row):")
for col in df.columns:
    print(f"{col}: {type(df[col].iloc[0])}")
| Name | SMILES | Mol | |
|---|---|---|---|
| 0 | Atracurium | C[N+]1(CCC2=CC(=C(C=C2C1CC3=CC(=C(C=C3)OC)OC)O... | |
| 1 | Cisatracurium | C[N+]1(CCC2=CC(=C(C=C2C1CC3=CC(=C(C=C3)OC)OC)O... | |
| 2 | Vecuronium | CC(=O)OC1CC2CCC3C(C2(CC1N4CCCCC4)C)CCC5(C3CC(C... | |
| 3 | Rocuronium | CC(=O)OC1C(CC2C1(CCC3C2CCC4C3(CC(C(C4)O)N5CCOC... | |
| 4 | Pancuronium | CC(=O)OC1CC2CCC3C(C2(CC1[N+]4(CCCCC4)C)C)CCC5(... | |
| 5 | Mivacurium | C[N+]1(CCC2=CC(=C(C=C2C1CC3=CC(=C(C(=C3)OC)OC)... | |
| 6 | Tubocurarine | CN1CCC2=CC(=C3C=C2C1CC4=CC=C(C=C4)OC5=C6C(CC7=... | |
Column data types (based on first row):
Name: <class 'str'>
SMILES: <class 'str'>
Mol: <class 'rdkit.Chem.rdchem.Mol'>
Drop SMILES Column#
Let’s remove the SMILES string since we no longer need it
df.drop(columns=["SMILES"], inplace=True)
df
| Name | Mol | |
|---|---|---|
| 0 | Atracurium | |
| 1 | Cisatracurium | |
| 2 | Vecuronium | |
| 3 | Rocuronium | |
| 4 | Pancuronium | |
| 5 | Mivacurium | |
| 6 | Tubocurarine | |
Lipinski Rule of Five:#
A compound is likely to have good oral bioavailability if:
Rule |
Threshold |
Why it matters |
|---|---|---|
≤ 5 hydrogen bond donors |
H-bond donors = NH, OH groups |
Too many → low permeability |
≤ 10 hydrogen bond acceptors |
H-bond acceptors = N, O atoms |
Too many → low absorption |
MW ≤ 500 Da |
Molecular weight |
Too large → poor absorption |
logP ≤ 5 |
Partition coefficient (lipophilicity) |
Too greasy → poor solubility |
Note: It’s called “Rule of 5” because the numbers involved (5, 10, 500, logP 5) are all multiples of 5.
We are now going to add 4 new columns by applying a function (Descriptors.X) to each Mol in the column using apply(). We can do this because the mol column is not a column of images but a column pointers to the location of the rdkit molecular object in memory
“MolWt” – Molecular Weight
“LogP” – Octanol-water partition coefficient
“HBD” – Number of H-bond donors
“HBA” – Number of H-bond acceptors
from rdkit.Chem import Descriptors

df["MolWt"] = df["Mol"].apply(Descriptors.MolWt)
df["LogP"] = df["Mol"].apply(Descriptors.MolLogP)
df["HBD"] = df["Mol"].apply(Descriptors.NumHDonors)
df["HBA"] = df["Mol"].apply(Descriptors.NumHAcceptors)
df
| Name | Mol | MolWt | LogP | HBD | HBA | |
|---|---|---|---|---|---|---|
| 0 | Atracurium | |
929.161 | 8.0655 | 0 | 12 |
| 1 | Cisatracurium | |
929.161 | 8.0655 | 0 | 12 |
| 2 | Vecuronium | |
557.840 | 5.9659 | 0 | 5 |
| 3 | Rocuronium | |
529.786 | 4.4075 | 1 | 5 |
| 4 | Pancuronium | |
572.875 | 6.1105 | 0 | 4 |
| 5 | Mivacurium | |
1029.278 | 9.0290 | 0 | 14 |
| 6 | Tubocurarine | |
609.743 | 6.7010 | 2 | 7 |
Create Boolean Mask#
Now we want to set up a Boolean Mask based on Lipinski’s Rules. These columns are a set of True/False values based on a criteria.
Property |
Threshold |
|---|---|
Molecular Weight |
≤ 500 |
LogP |
≤ 5 |
HBD |
≤ 5 |
HBA |
≤ 10 |
mw_ok   = df["MolWt"] <= 500
logp_ok = df["LogP"]  <= 5
hbd_ok  = df["HBD"]   <= 5
hba_ok  = df["HBA"]   <= 10
print(mw_ok)
print(type(mw_ok))
0    False
1    False
2    False
3    False
4    False
5    False
6    False
Name: MolWt, dtype: bool
<class 'pandas.core.series.Series'>
Lets now add new columns for each of the Boolean Series we created
df["MW_OK"]   = mw_ok
df["LogP_OK"] = logp_ok
df["HBD_OK"]  = hbd_ok
df["HBA_OK"]  = hba_ok
df
| Name | Mol | MolWt | LogP | HBD | HBA | MW_OK | LogP_OK | HBD_OK | HBA_OK | |
|---|---|---|---|---|---|---|---|---|---|---|
| 0 | Atracurium | |
929.161 | 8.0655 | 0 | 12 | False | False | True | False |
| 1 | Cisatracurium | |
929.161 | 8.0655 | 0 | 12 | False | False | True | False |
| 2 | Vecuronium | |
557.840 | 5.9659 | 0 | 5 | False | False | True | True |
| 3 | Rocuronium | |
529.786 | 4.4075 | 1 | 5 | False | True | True | True |
| 4 | Pancuronium | |
572.875 | 6.1105 | 0 | 4 | False | False | True | True |
| 5 | Mivacurium | |
1029.278 | 9.0290 | 0 | 14 | False | False | True | False |
| 6 | Tubocurarine | |
609.743 | 6.7010 | 2 | 7 | False | False | True | True |
Now lets make a Lipinski Score for the total pass count based on the 4 conditions
df["LipinskiPassCount"] = df[["MW_OK", "LogP_OK", "HBD_OK", "HBA_OK"]].sum(axis=1)
df["LipinskiFailCount"] = 4 - df["LipinskiPassCount"]
df
| Name | Mol | MolWt | LogP | HBD | HBA | MW_OK | LogP_OK | HBD_OK | HBA_OK | LipinskiPassCount | LipinskiFailCount | |
|---|---|---|---|---|---|---|---|---|---|---|---|---|
| 0 | Atracurium | |
929.161 | 8.0655 | 0 | 12 | False | False | True | False | 1 | 3 |
| 1 | Cisatracurium | |
929.161 | 8.0655 | 0 | 12 | False | False | True | False | 1 | 3 |
| 2 | Vecuronium | |
557.840 | 5.9659 | 0 | 5 | False | False | True | True | 2 | 2 |
| 3 | Rocuronium | |
529.786 | 4.4075 | 1 | 5 | False | True | True | True | 3 | 1 |
| 4 | Pancuronium | |
572.875 | 6.1105 | 0 | 4 | False | False | True | True | 2 | 2 |
| 5 | Mivacurium | |
1029.278 | 9.0290 | 0 | 14 | False | False | True | False | 1 | 3 |
| 6 | Tubocurarine | |
609.743 | 6.7010 | 2 | 7 | False | False | True | True | 2 | 2 |
rule_cols = ["MW_OK", "LogP_OK", "HBD_OK", "HBA_OK"]
pass_fail_matrix = df[rule_cols]

pass_fail_matrix
| MW_OK | LogP_OK | HBD_OK | HBA_OK | |
|---|---|---|---|---|
| 0 | False | False | True | False |
| 1 | False | False | True | False |
| 2 | False | False | True | True |
| 3 | False | True | True | True |
| 4 | False | False | True | True |
| 5 | False | False | True | False |
| 6 | False | False | True | True |
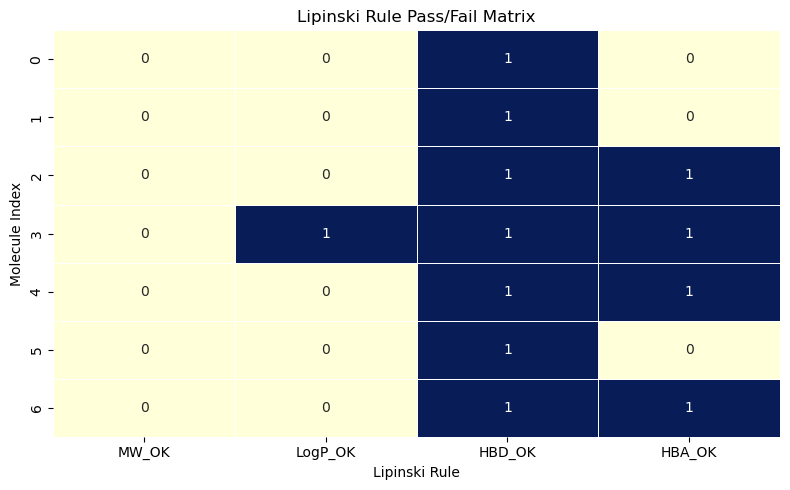
pass_fail_numeric = pass_fail_matrix.astype(int)
pass_fail_numeric
| MW_OK | LogP_OK | HBD_OK | HBA_OK | |
|---|---|---|---|---|
| 0 | 0 | 0 | 1 | 0 |
| 1 | 0 | 0 | 1 | 0 |
| 2 | 0 | 0 | 1 | 1 |
| 3 | 0 | 1 | 1 | 1 |
| 4 | 0 | 0 | 1 | 1 |
| 5 | 0 | 0 | 1 | 0 |
| 6 | 0 | 0 | 1 | 1 |
import seaborn as sns
import matplotlib.pyplot as plt

plt.figure(figsize=(8, 5))
sns.heatmap(pass_fail_numeric, annot=True, cmap="YlGnBu", cbar=False, linewidths=0.5)

plt.title("Lipinski Rule Pass/Fail Matrix")
plt.xlabel("Lipinski Rule")
plt.ylabel("Molecule Index")
plt.tight_layout()
plt.show()